Weather at a glance
The most important information
More specific weather information can be found on the islands pages. Go to our Explorer page!
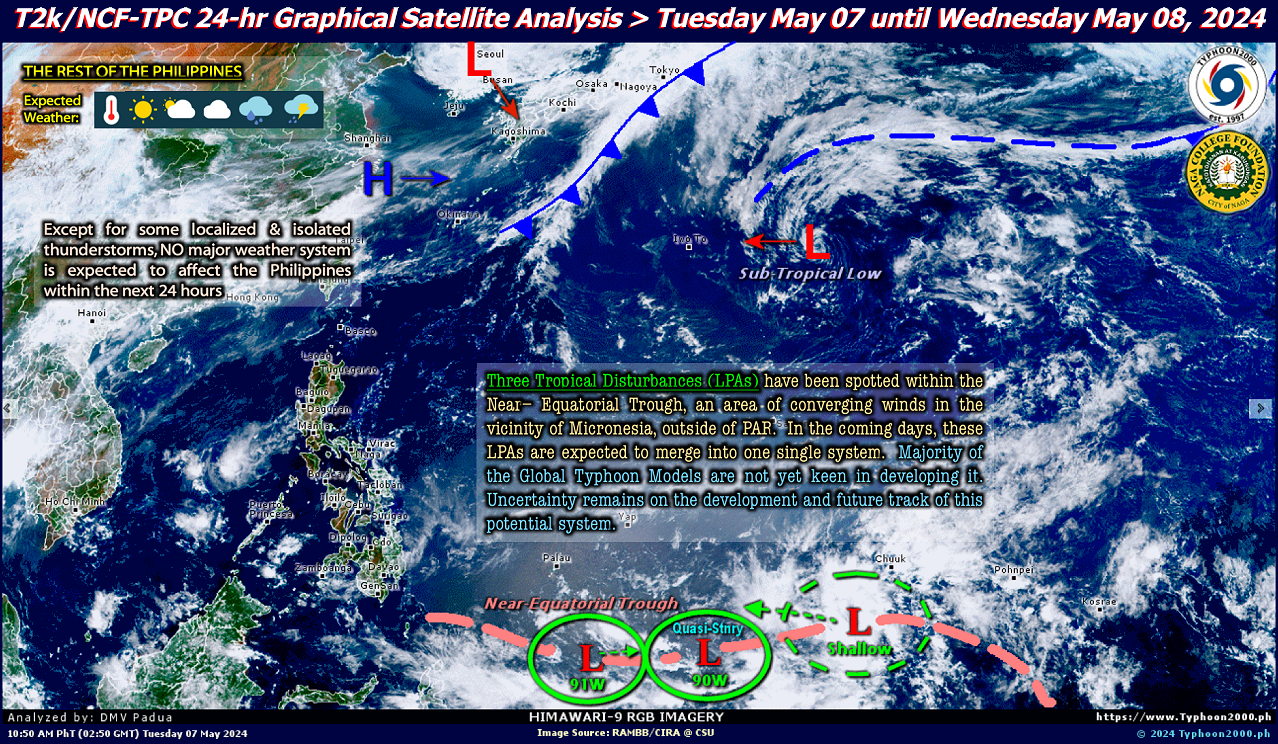
The Analysis
This analysis is made by the group of David Michael V. Padua, the famous meteorologist from Naga City.
Michael Padua is known all over the Philippines for his outstanding website "Typhoon2000". This website is extremely useful when a typhoon develops and approaches the Philippines.
The original data comes from NOAA, the US National Oceanic and Atmospheric Administration.
Click on the image to enlarge!
Weather Analysis
The pressure
This map shows the isobars. Isobars are lines that link points of same atmospheric pressure.
If the isobars (the lines) are far from each other, then you may expect only weak or even no wind.
But when the isobars are very near, then it gets windy.
Storms have nearly concentric isobars around the center. In the center you find an L for "Low Pressure". Often the direction of the forward movement is indicated by arrows.
Severe storms are also marked with a cone out from the center. This cone shows the probability zone, where the center of the storm will pass.
Date and time of the map are displayed in the rectangular boxes. The format is 071800UTC MAY.2021. 07 is the day 1800UTC means 8 PM in UK. For the Philippines add 8 hours. Then come month and year.

Data source: JMA - Japan Meteorological Agency, 1-3-4 Otemachi, Chiyoda-ku, Tokyo 100-8122, Japan
Animated with HAniS - our thanks go to Tom Whittaker of the University of Wisconsin
Atmospheric analysis
This almost raw map shows the data of the weather stations. It contains a primary analysis of the pressure on ground level. This is expressed in the isobar lines and if applicable, in the front lines.
Click on the image to enlarge!

This pressure analysis is provided by PAGASA.
Weather Analysis