More Typhoons? Less Typhoons?
When a new tropical storm or a typhoon is approaching the people in the Philippines start to discuss. The hottest topic is the increase of typhoons in the last years.
Is this true?
During the last days we did analyze the tropical storms and typhoons between 1950 and 2008. These are more than 50 years of statistical data.
If you want to prove something you can use the same statistical data as if you want to prove the contrary.
This is why you should know:
– We analyzed all tropical storms and typhoons of 100°-140° east and 0°-40° north.
– We only counted storms with sustained wind speed (10 minutes average) of over 63km/h
– About 50% of all storms did not make landfall and only few touched the Philippines.

This chart shows clearly that the average number of typhoons per year decreased in the last years, while 1990s encountered more than the average (blue line) number of typhoons.

The months of July, August and September are the typhoon months. February and March are the most quiet months. (The 2000s line is only up to September 21, 2008. This is why it is lower than the others).
For more information read here TYPHOONS, here 2008 TYPHOONS and here CLIMATE.
Related posts
 November 18, 2015 Tropical Storm IN-FA moving west Tropical Storm IN-FA is moving west. This storm is still far away from the Philippines but has the potential to amplify to a Typhoon Cat. […]
- October 15, 2015 Tropical Storm KOPPU/Lando a bit slower Tropical Storm KOPPU/Lando advanced a bit slower than forecasts predicted. While still moving westward it gained a bit of strength. The […]
- October 14, 2015 Tropical Storm KOPPU/Lando straight westward Tropical Storm KOPPU/Lando continues on its westward track. It has slightly slowed down the forward speed from 25 to 20 km/h. It has […]
- October 13, 2015 Two Tropical Depressions in a row Two Tropical Depressions in a row are approaching the Philippines. The nearer one at 142° E, is moving westward at 15 km/h. The second one […]
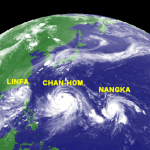
- July 8, 2015 CHAN-HOM and NANGKA – Habagat Amplifiers Last weekend, Tropical Storm LINFA/Egay brought a lot of rain over northern Luzon. Now it is enhancing the southwest monsoon (Habagat) […]


Recent Comments